3 Fundamentals of Research
- Introduction to R and RStudio
- History of R
- R Packages
- What is Research?
- Types of Research
- Research Design
- Data Analysis and Interpretation
- Reporting and Communication
- Creating Portfolio
3.1 Introduction to R and RStudio
R is a programming language primarily used for statistical computing and graphics, while RStudio is an integrated development environment (IDE) that enhances the R programming experience.
Essentially, R is the engine, and RStudio is the user-friendly interface that makes it easier to work with that engine.
3.1.1 How to Install R and R Studio
Install R and RStudio by following the instructions in the video
Install Links
Open Source Version:
RStudio Server Download for Linux
Commecial Version:
3.1.2 RStudio - an Overview
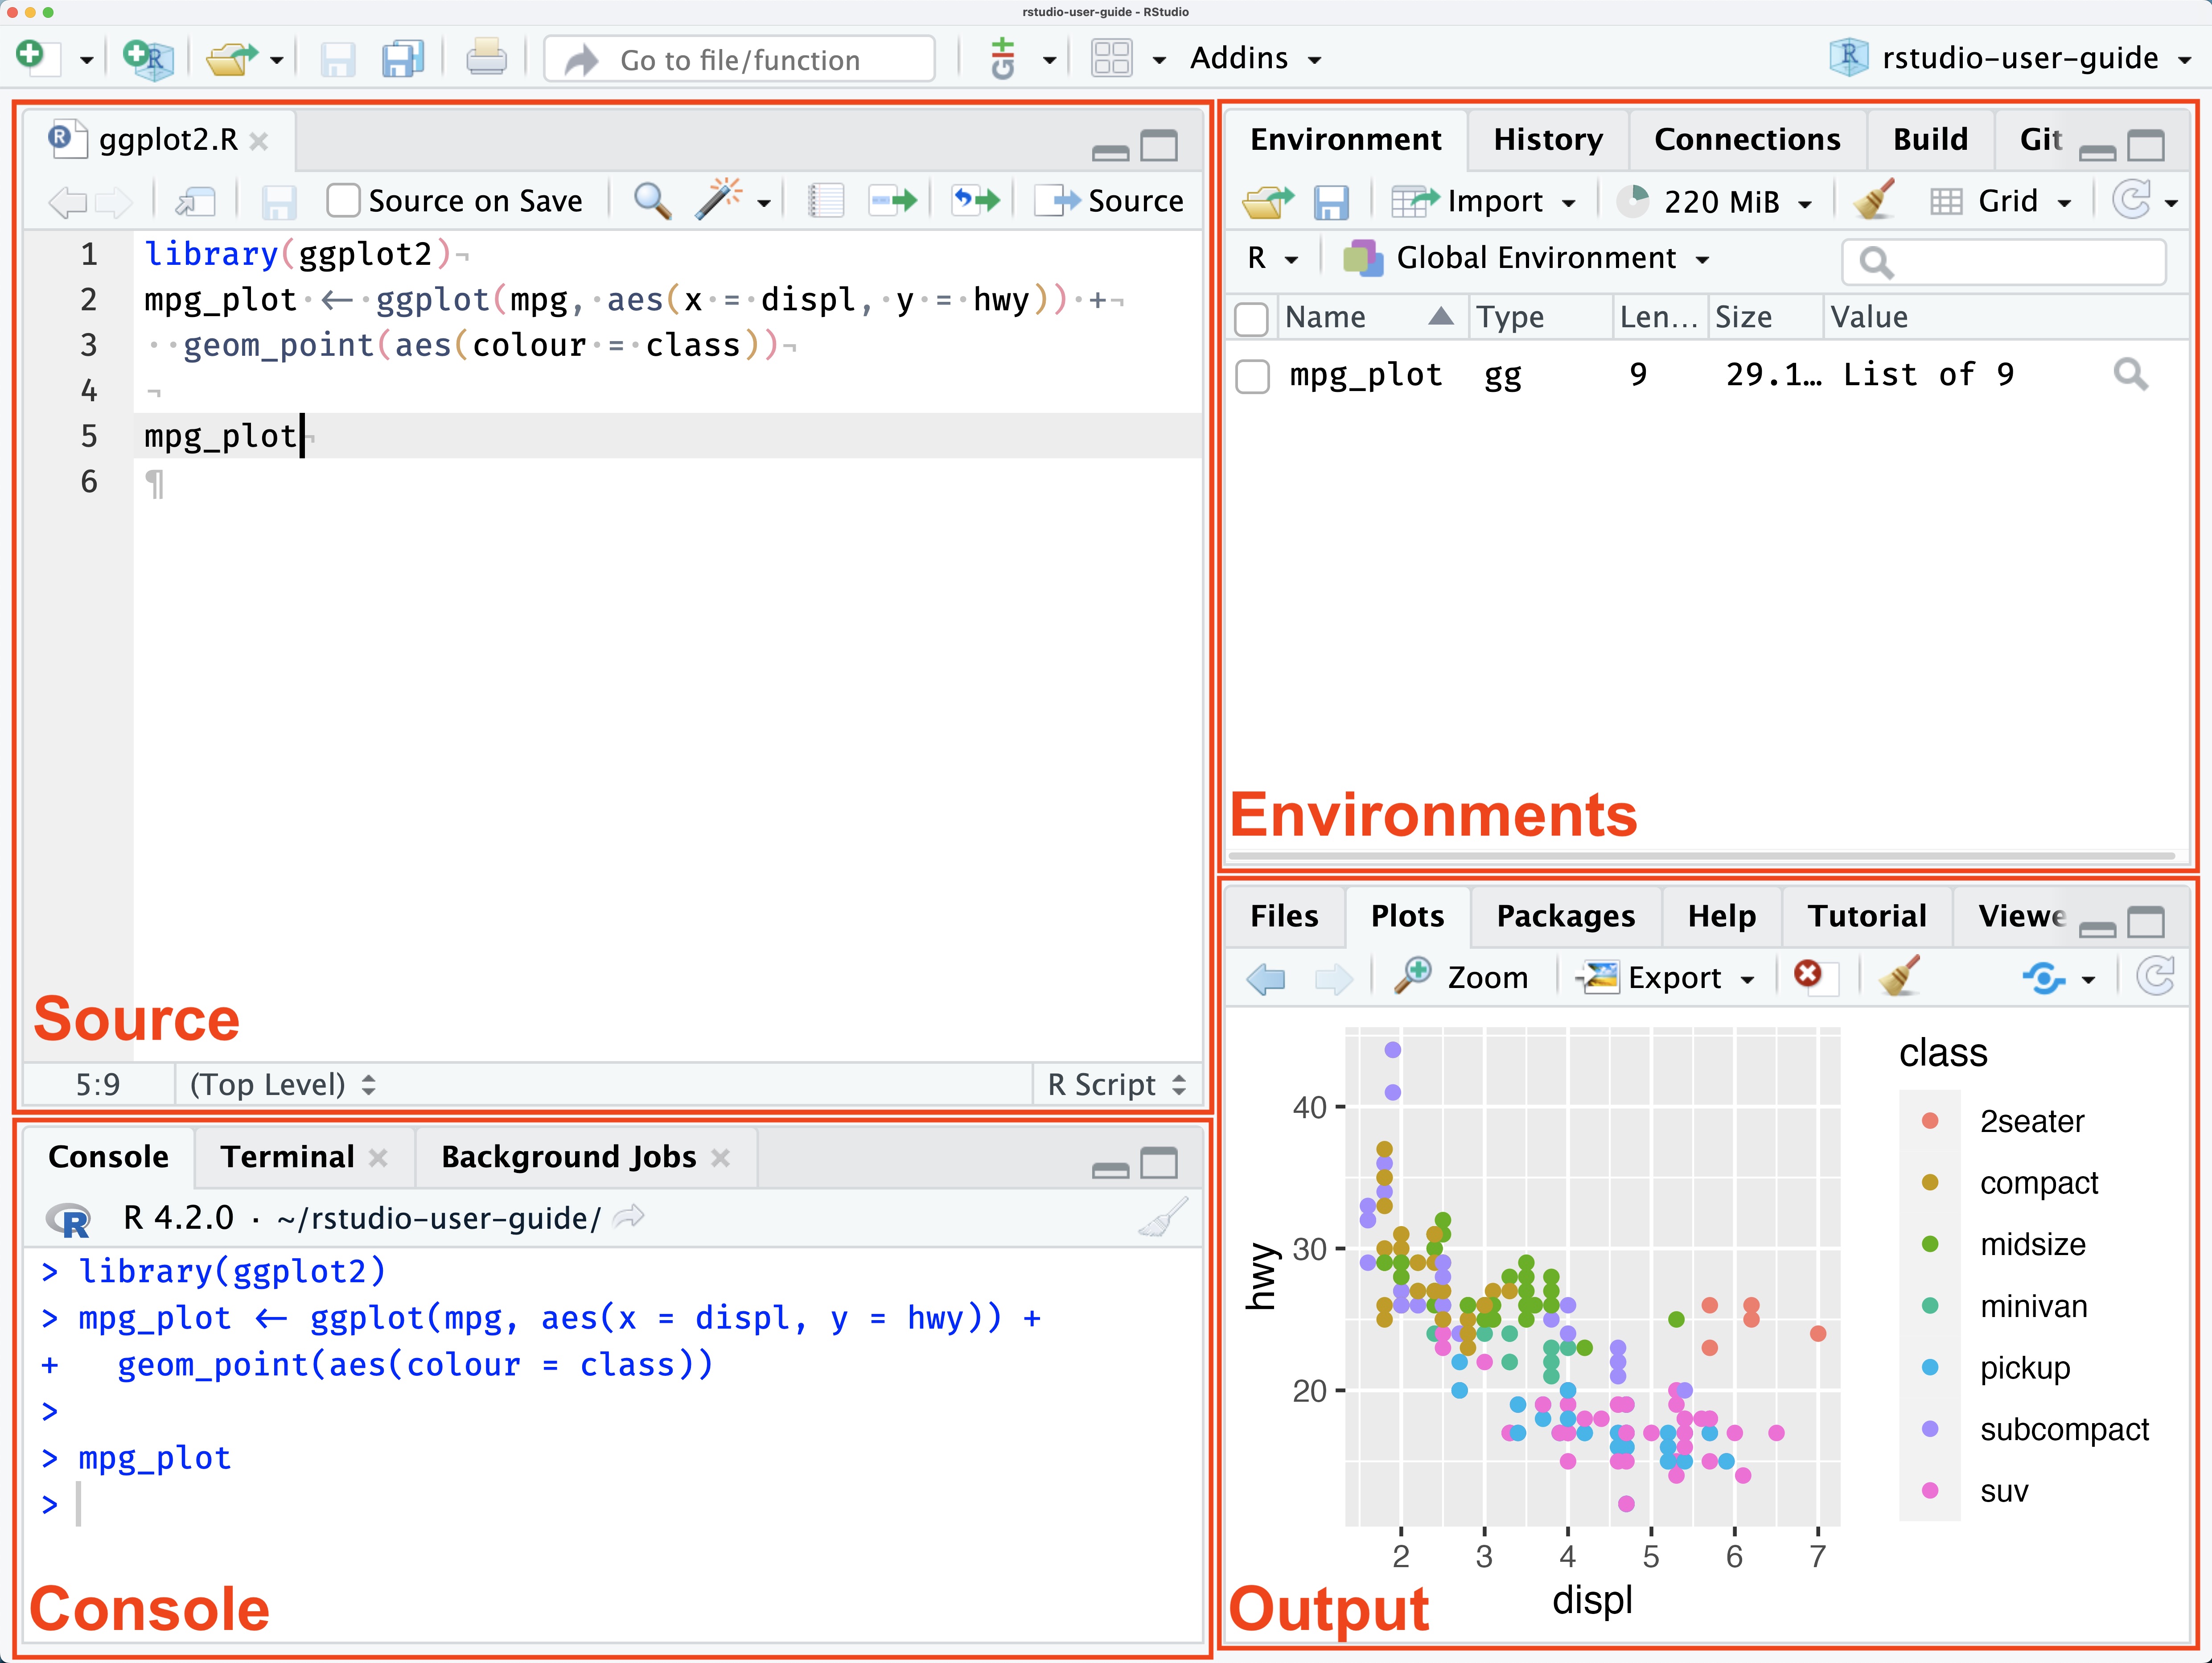 RStudio IDE is mainly divided into four panes as shown in ?fig-ide – Source, Console, Environment and Output.
Source
Source pane of IDE is used to write programs/scripts. The Source pane is where you can edit and save R or Python scripts or author computational documents like Quarto and R Markdown.
Console
The Console pane is used to write short interactive R commands and it shows the output of the commands and status of the command triggered. Whenever command is run it is executed after sign “>” in the console.
Environment
The Environment pane displays temporary R objects as created during that R session.
Output
The Output pane displays the plots, tables, or HTML outputs of executed code along with files saved to disk.
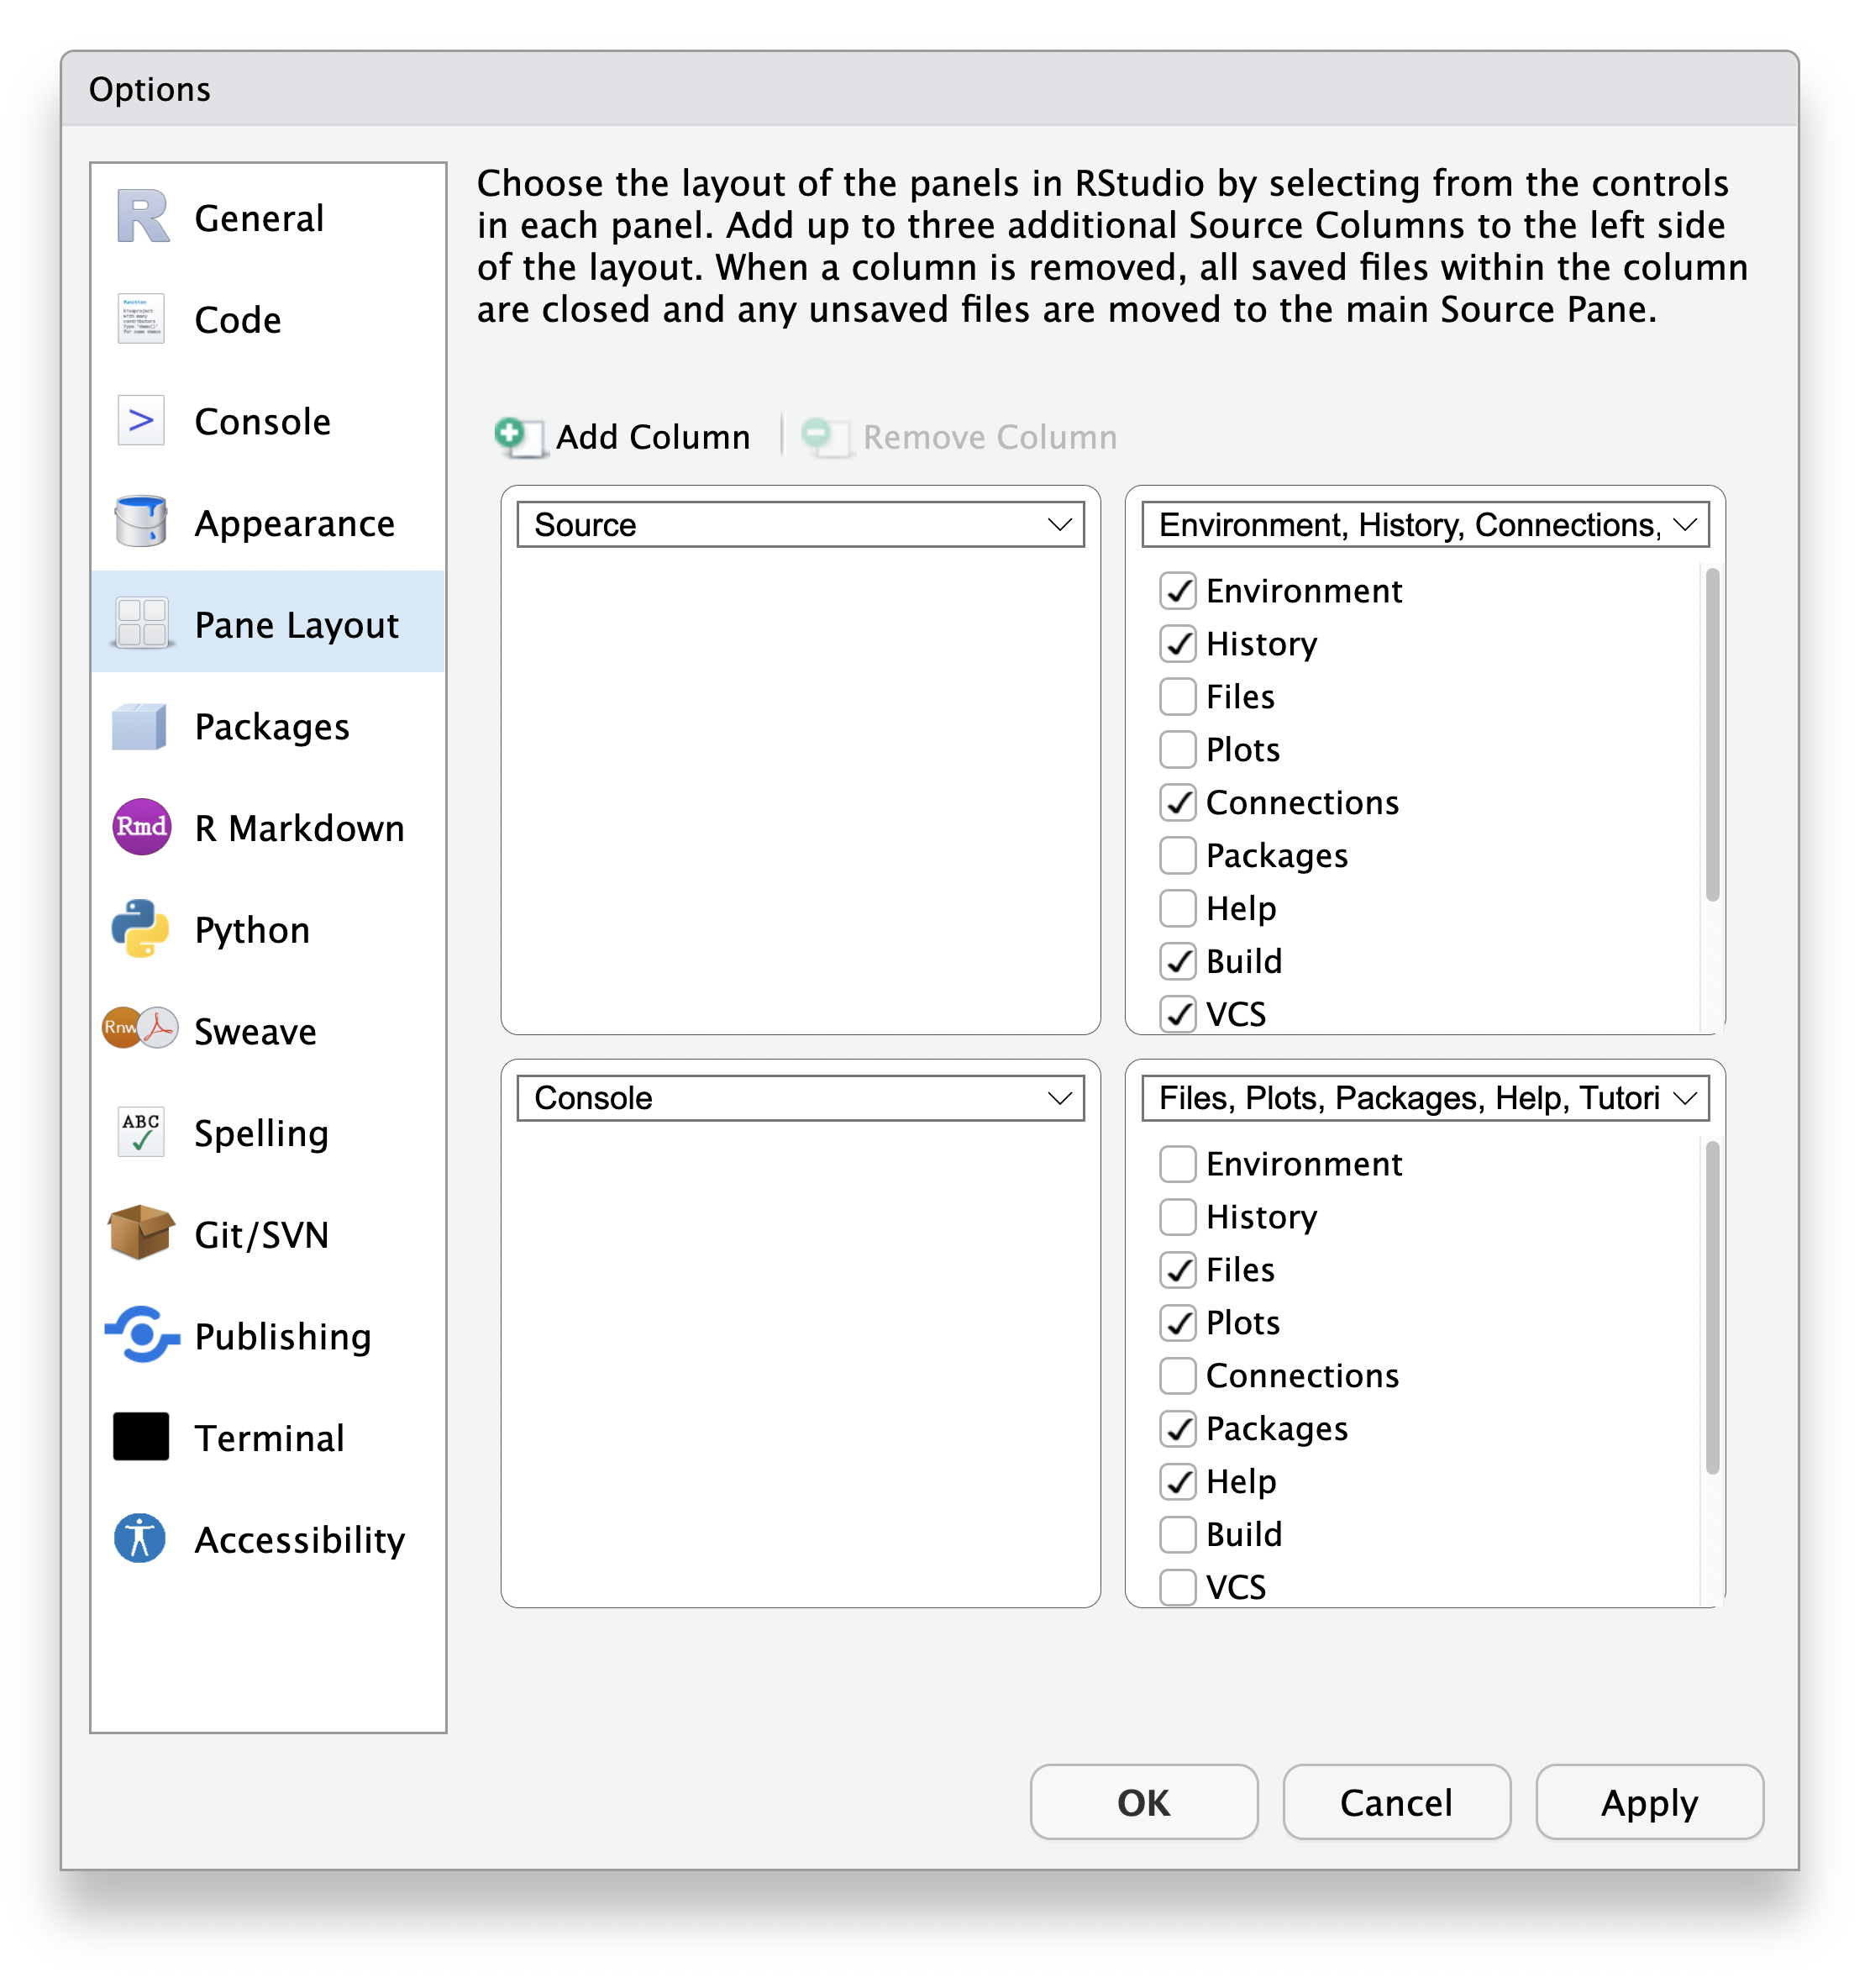
You can change pane layout from Tools>Global Options>pane Layout, see ?fig-panelayout :
 :::{.callout-tip title=“Exercise 1”}
Change the pane layout to have Source at bottom left, Output at top left, Console at top right and Environment at bottom right.
:::
3.1.3 Managing Files in RStudio
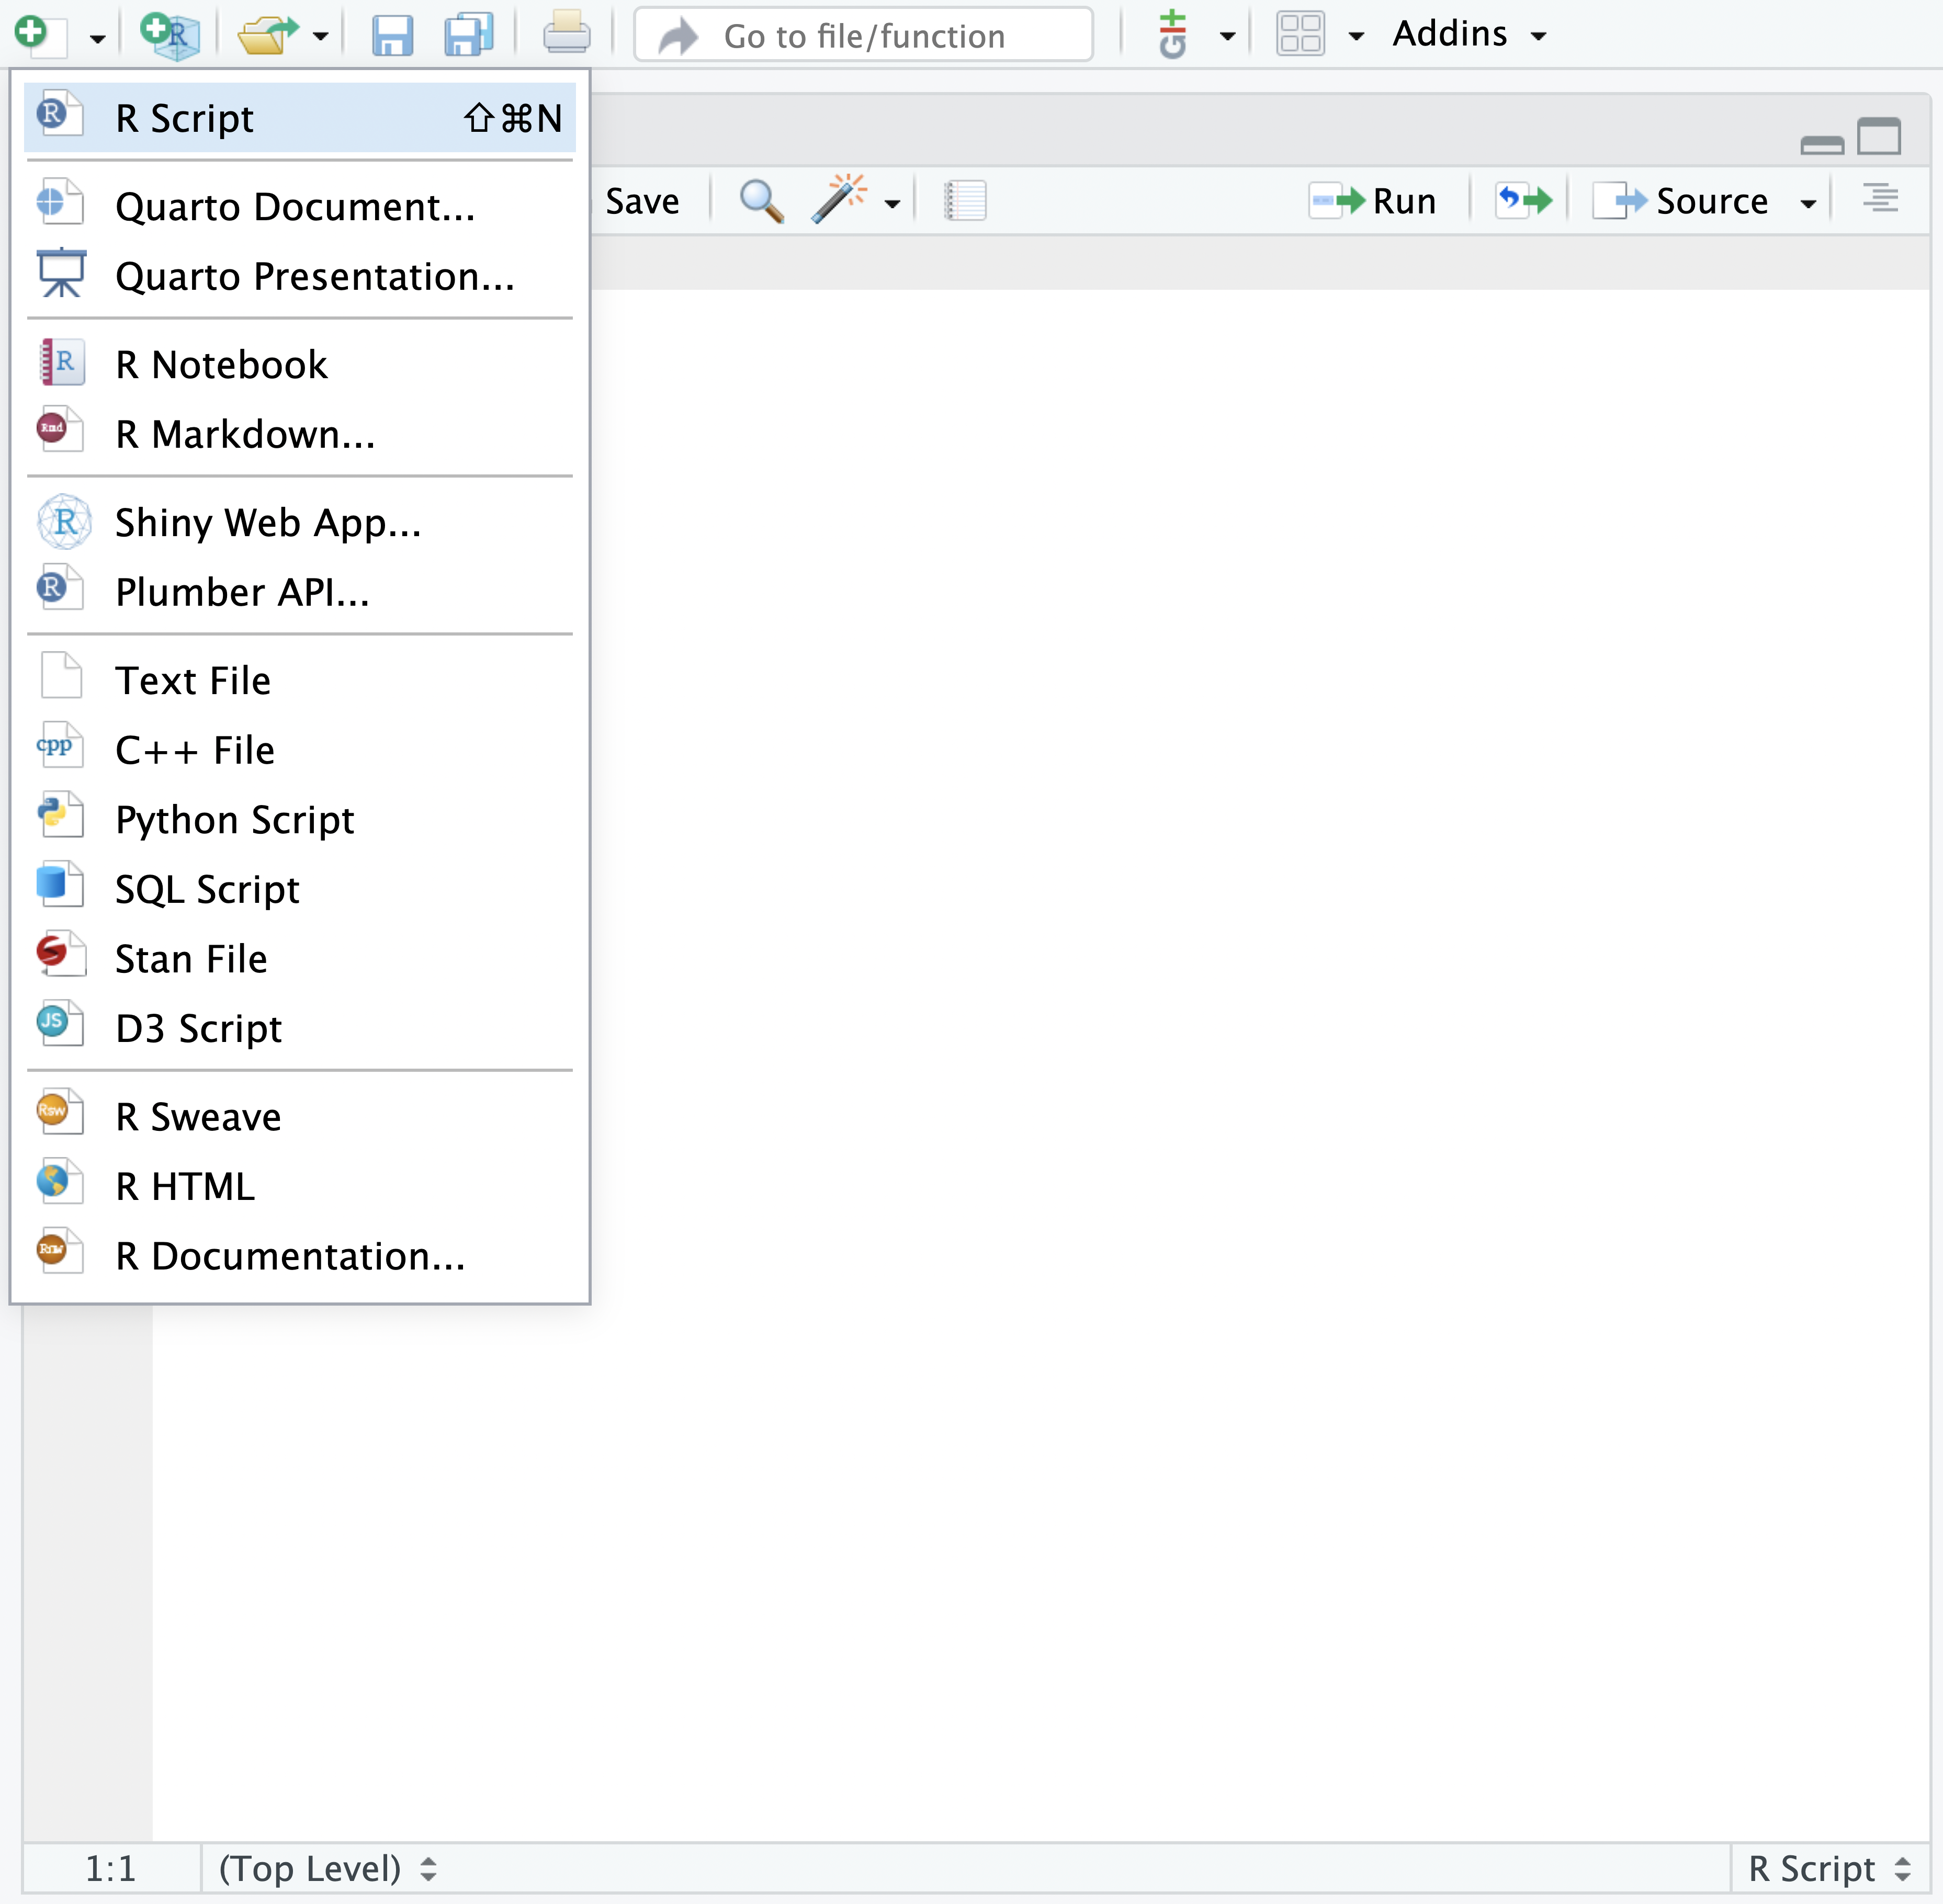
You can create multiple file formats using new file tab from the File>New File menu and create new project environment from File>New Project:
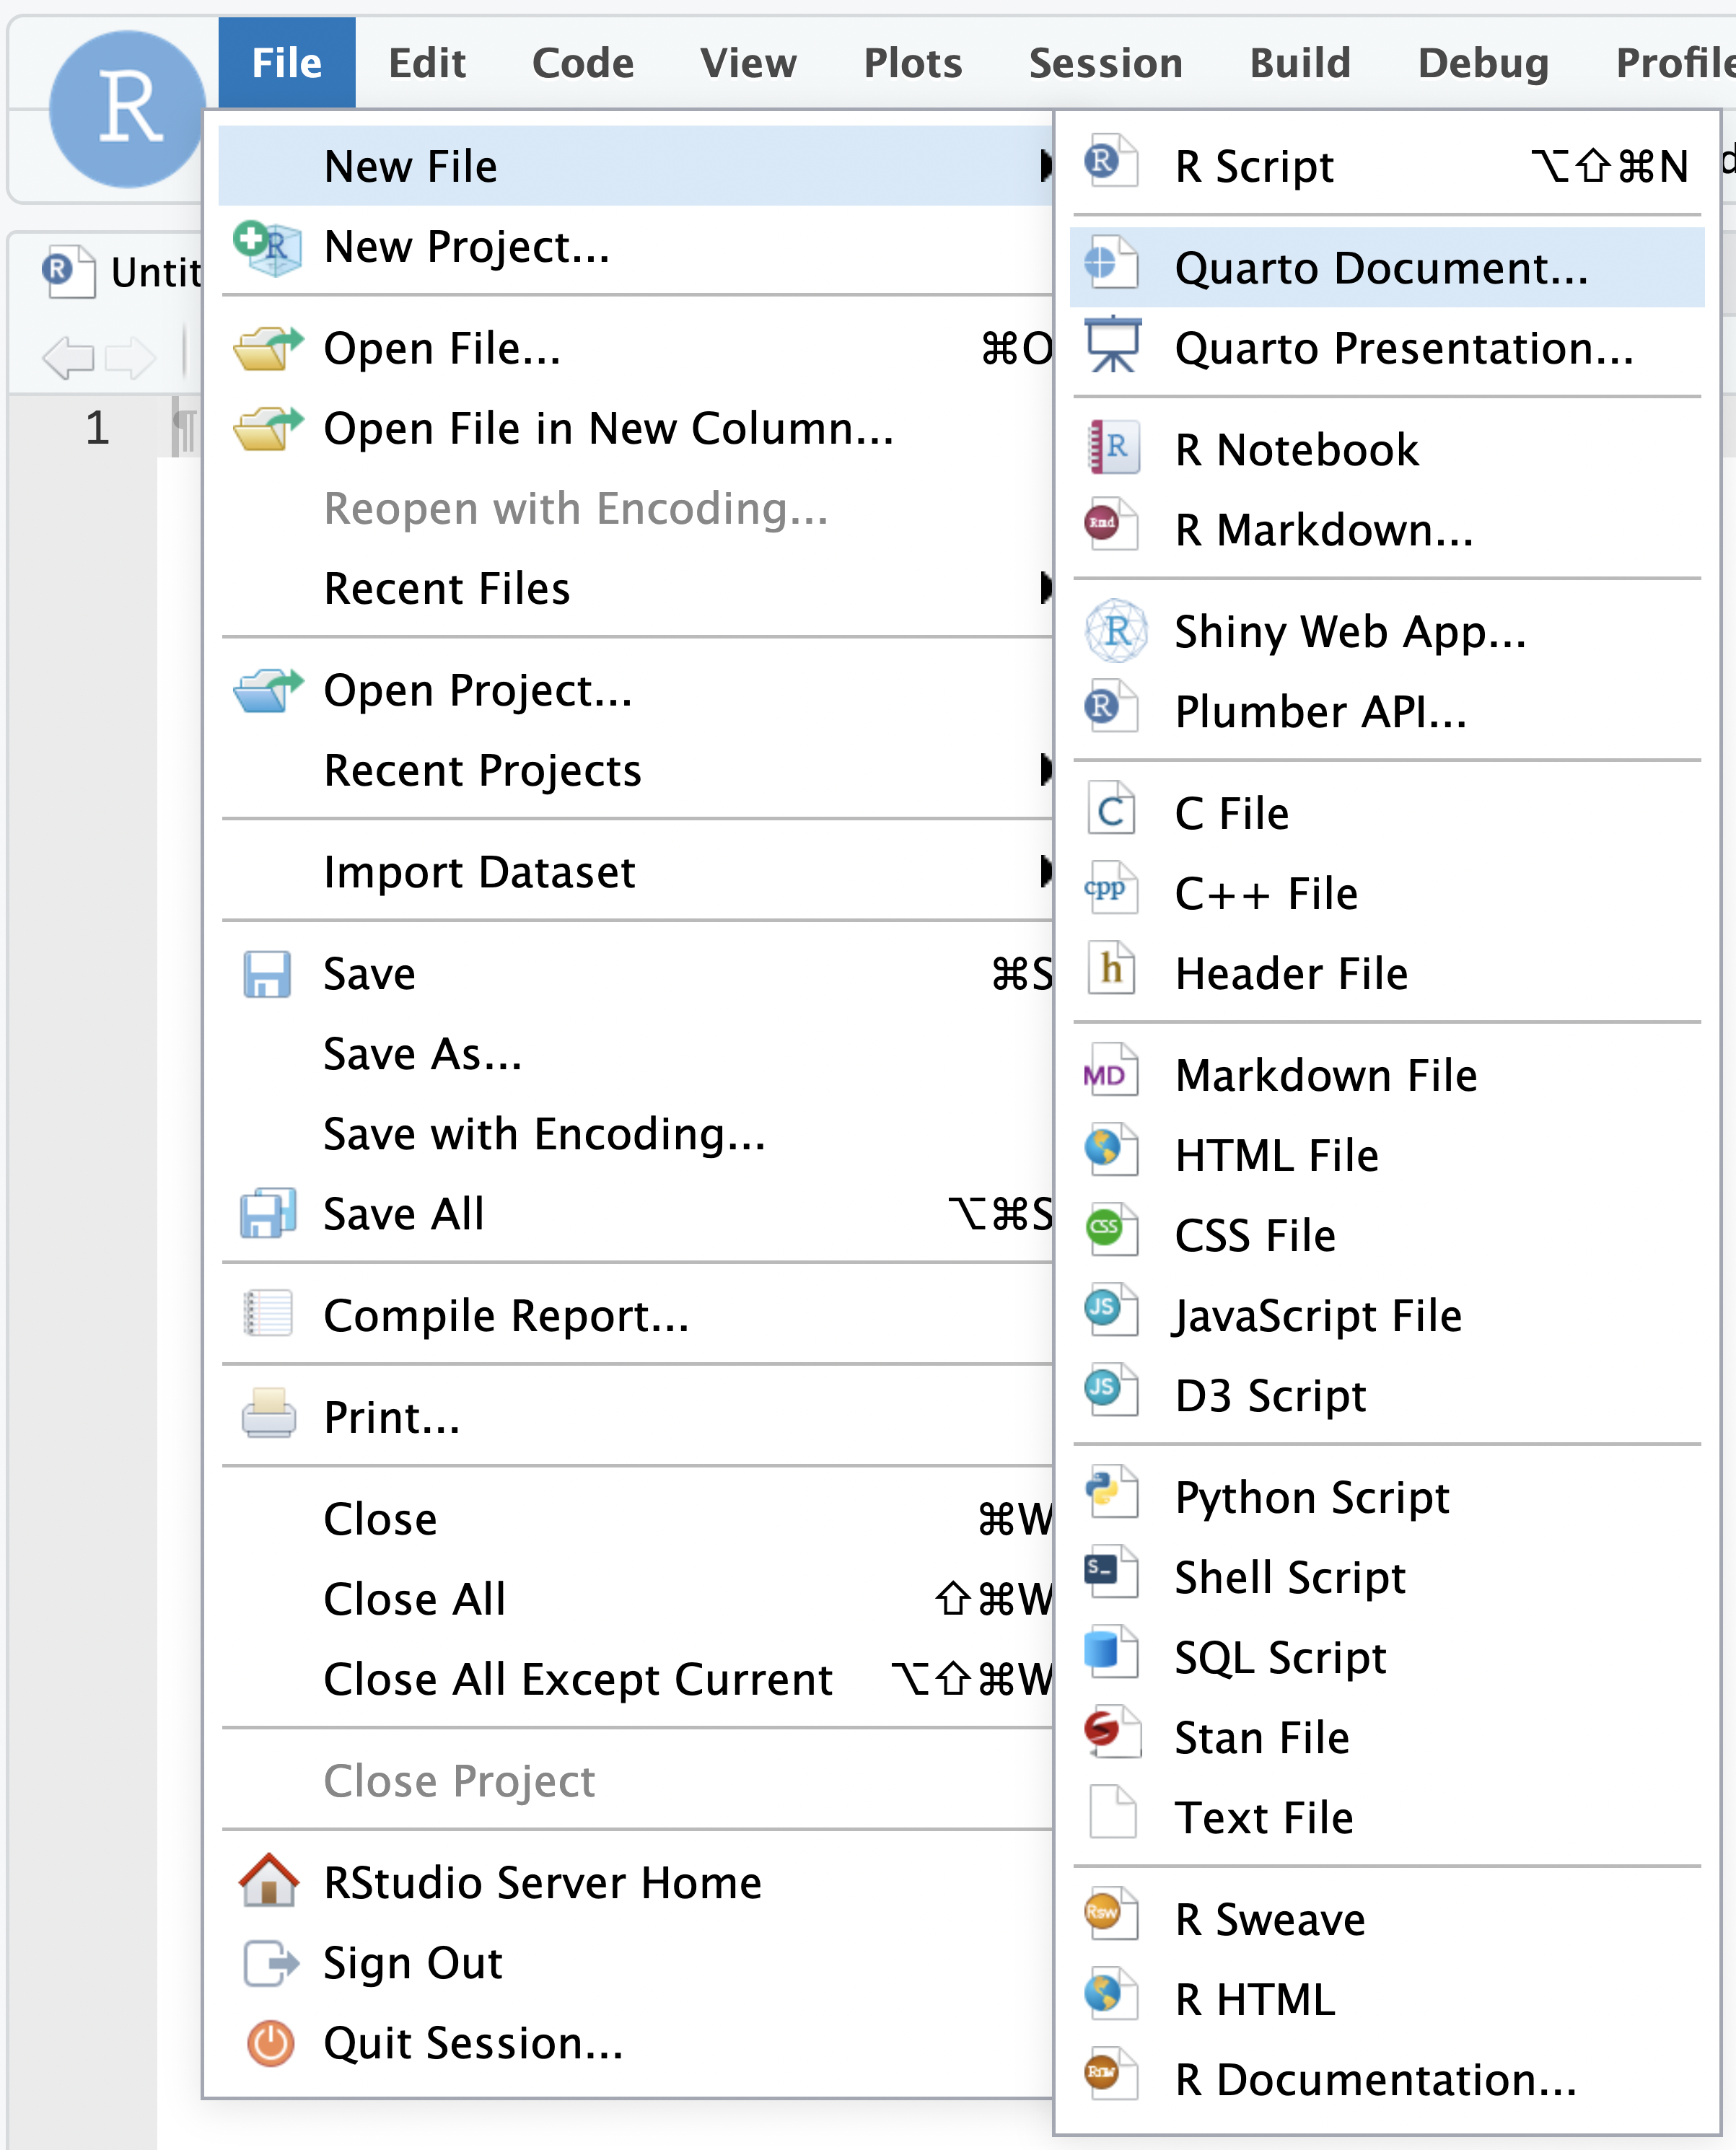
An alternative workflow is to use the visual elements in the RStudio menu, see Figure 3.1.
3.1.4 RStudio Projects
Expert data scientists keep all the files associated with a given project together — input data, scripts, analytical results, and figures. This is such a wise and common practice that RStudio has built-in support for this via Projects. RStudio Projects make it straightforward to divide your work into multiple contexts, each with their own working directory, workspace, history, and source documents.
Creating New Project
Studio projects are associated with R working directories.
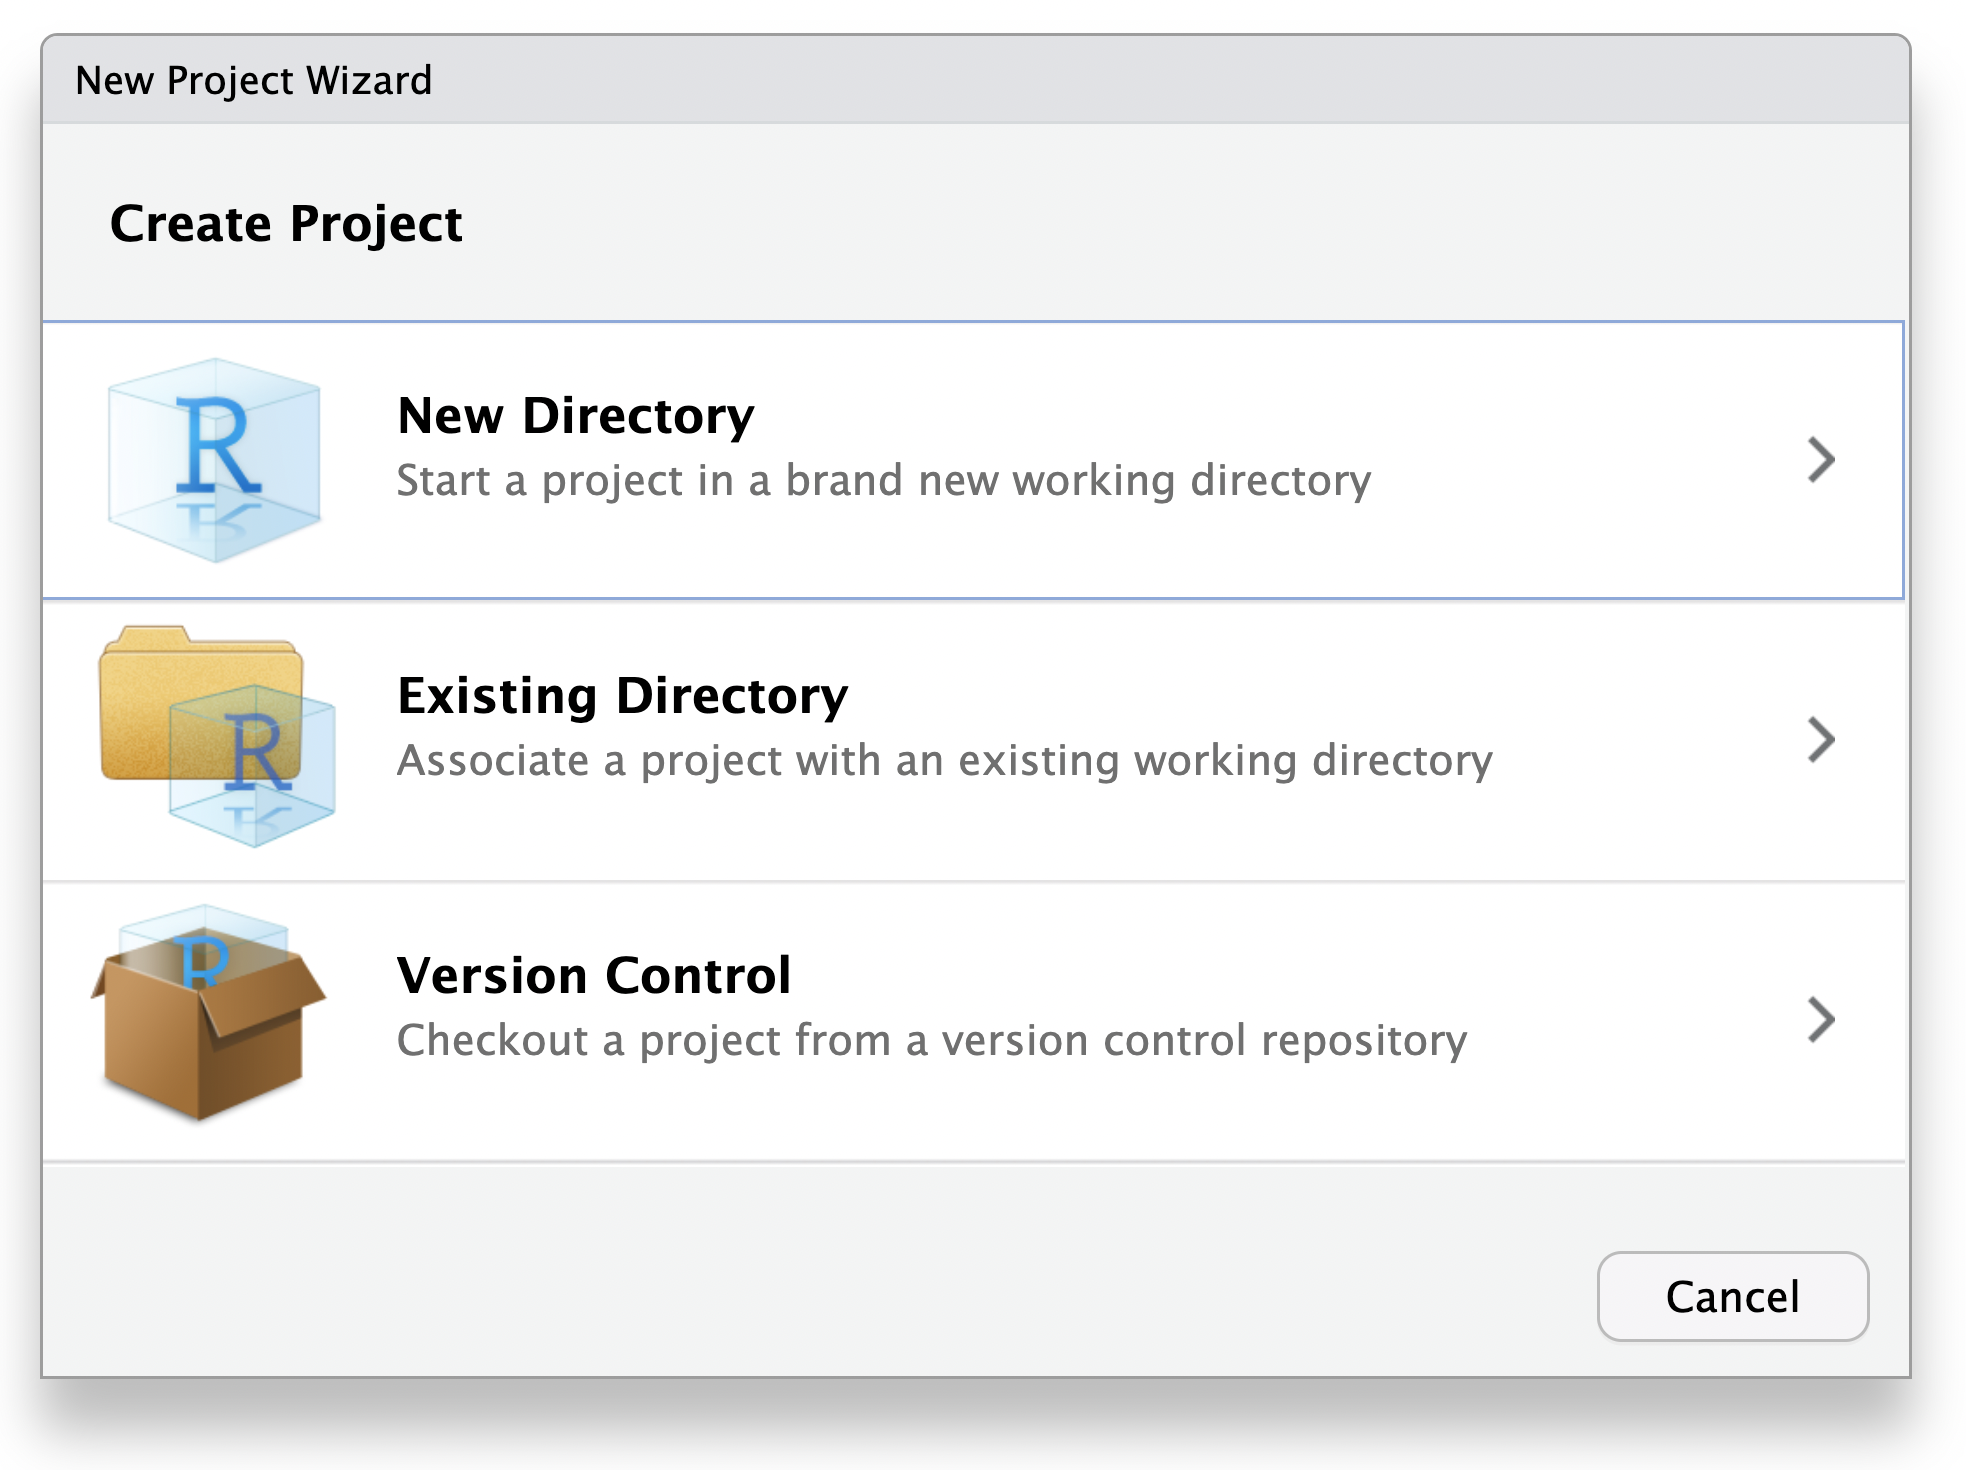
RStudio projects can be created:
In a brand new directory
In an existing directory where you already have R code and data
By cloning a version control (Git or Subversion) repository
To create a new project in RStudio, use File > New Project or use the New Project button (available on the Projects toolbar in the top right corner or on the global toolbar at the top left corner).
This will open the “New Project Wizard” popup:
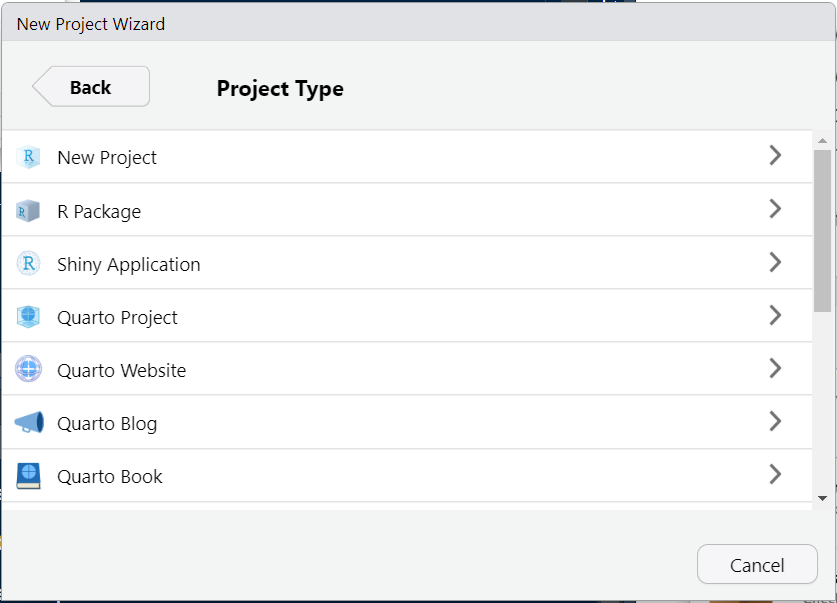
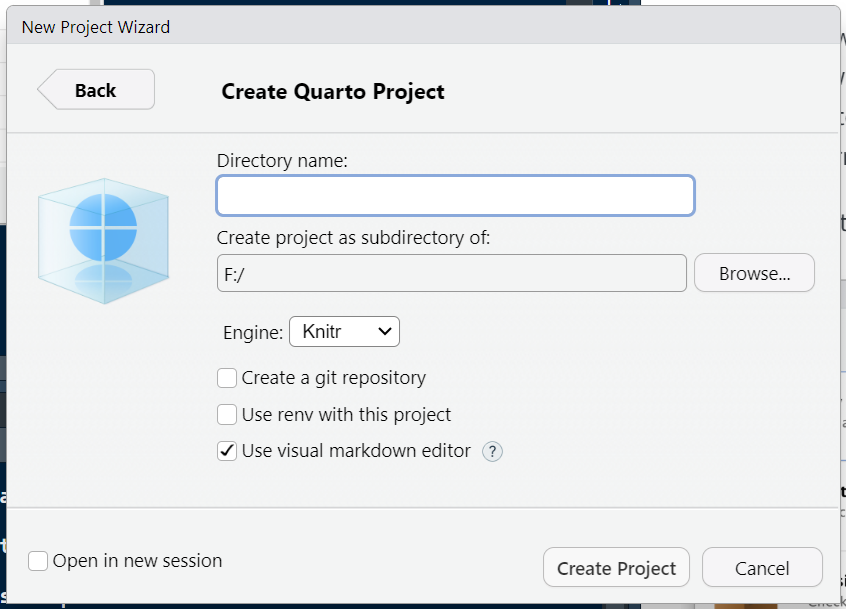
Here, you create project by giving a unique name and save it into a project directory on your desktop.
Once a project is created, following set of files and folders are created in the project folder:
Creates a project file (with an .Rproj extension) within the project directory. This file contains various project options (discussed below) and can also be used as a shortcut for opening the project directly from the filesystem.
Creates a hidden directory (named .Rproj.user) where project-specific temporary files (e.g. auto-saved source documents, window-state, etc.) are stored. This directory is also automatically added to .Rbuildignore, .gitignore, etc. if required.
Loads the project into RStudio and display its name in the Projects toolbar (which is located on the far right side of the main toolbar)
Besides this, there are many other files and folders created depending on type of project. For instance to create this website in R Projects, following set of files and folders are created in the project directory:
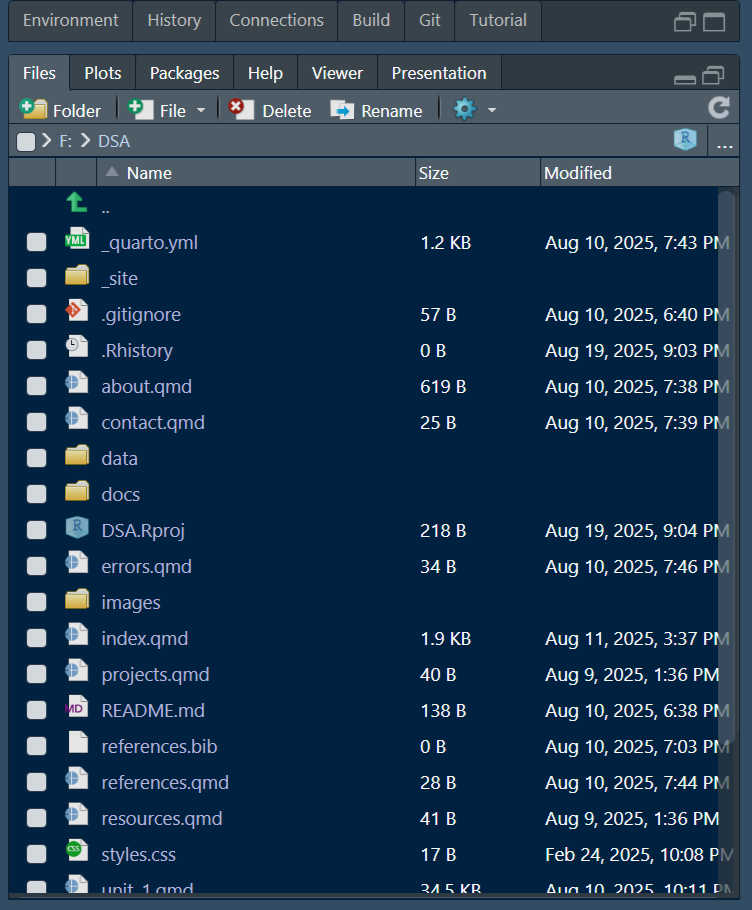
Some files are automatically created while generating the projects and some are added by the developer/author/programmer.
- _quarto.yml is created automatically
- _sample.qmd is created automatically
- projectname.Rproj is created automatically
- docs/_site folder is created automatically (_site for website project)
- .Rhistory file is created automatically
- styles.css file is created automatically
- references.bib file is created automatically (for manuscript project)
- images folder is created automatically
- data folder is created automatically
- index.qmd file is created automatically
Folder and Files in the project can be created, renamed, modified, deleted from the tabs on task bar on Output menu.
3.1.5 Other Applications of RStudio
- Quarto
Quarto is a platform to create documentations in various formats like pdf, word, ppt, html, etc. It can create static as well as interactive documents. Quarto is also useful in creating dashboard, research paper publishing, website and interactive data applications.
To see the various utilities of Quarto document visit this website.
- Rmarkdown
Just like Quarto is also a documentation framework in Rstudio but Quarto is better and advance version of Rmarkdown. Rmarkdown uses different packages to create different formats like bookdown package for book publishing, rticle package for manuscript, flexdashboard package for dashboard, etc. but in Quarto, it is one line modification to apply the desired modification and no need to install a separate package.
- Shiny
Shiny is web application framework to create data driven web application hosted on server and is made available through a web link. In the backend, two files ui.R and server.R work together to take input, process input and show the output. For example:
Shiny Apps are hosted on shinyapp.io or posit connect server. The first five app hosting on shinyapps.io are free of cost.
- Dashboard
Dashboard is a way to present data using data visuals, tabs, value boxes, text boxes, etc. These are arranged in systematic way and visually apeealing way.
For example:
3.2 History of R Programming
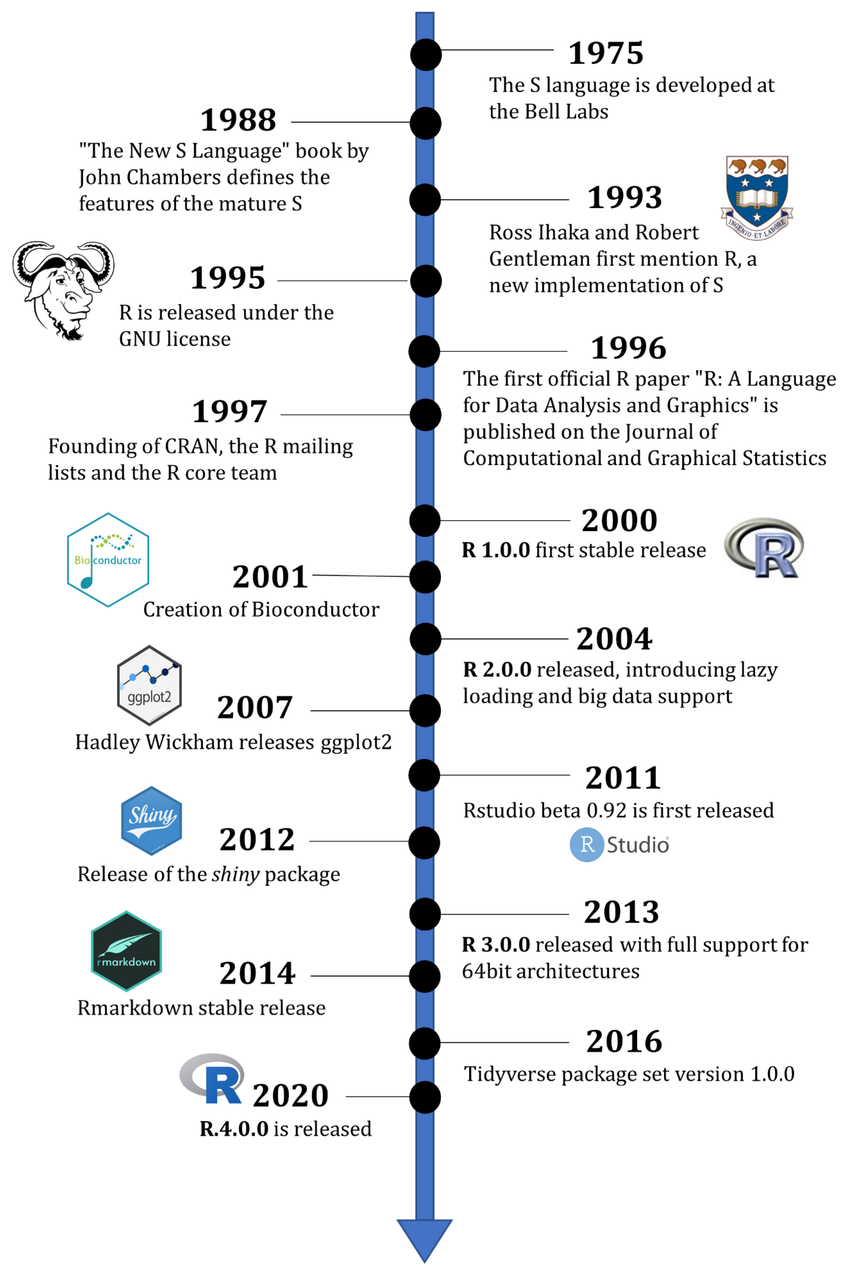 Source: https://www.researchgate.net/publication/360246719/figure/fig1/AS:11431281420367186@1746240950498/Timeline-of-R-history-with-selected-milestones.tif
Watch a video of history snapshot of R
3.3 R Packages
R packages are fundamental units in the R programming environment, serving as collections of R functions, compiled code, and sample data, all organized in a standardized format.
 Source: Article written by Adrian Josheph, PhD. Link to full article
They extend the core functionality of R, allowing users to access a vast array of specialized tools for various tasks in data science, statistics, machine learning, and more.
Read the research paper and submit a one page summary. Click Link to Access
3.4 What is Research?
Based on Excerpts from document published by Uttarakhand Open University link
Research is a process to discover new knowledge to find answers to a question. The word research has two parts re (again) and search (find) which denote that we are taking up an activity to look into an aspect once again or we want to look for some new information about something. E.g Front Office Executive has to learn about the facilities, timings, key features of products and services available at the hotel if one wants to become a wonderful sales professional other than being a host. “All progress is born of inquiry.
Clifford Woody states that research comprises defining and redefining problems, formulation of hypothesis; collection, organizing and evaluation of data; and reaching conclusions. Here it is emphasized that all research has to be systematic and logical to arrive at expected outcome.
D. Slesinger and M. Stephenson in the Encyclopedia of Social Sciences Research define research as “The manipulation of things, concepts or symbols for the purpose of generalizing to extend, correct or verify knowledge, whether that knowledge aids in construction of theory or in the practice of an art.”
Let’s understand the definition in better way in the context of agribusiness. In agribusiness, research can serve two main purposes: developing theories to understand agricultural systems better and applying that knowledge to improve practices on the farm or in the marketplace.
The construction of theory in agribusiness is about generating general principles and models that explain how agricultural processes work. For example, agricultural economists may study the relationship between fertilizer use and crop yield across different regions. After analyzing data, they may develop a theory that says “Beyond a certain point, increasing fertilizer does not significantly increase yield.” This theory helps policymakers, researchers, and educators understand the principle of diminishing returns in agriculture. It is knowledge meant to inform and guide — not necessarily to be applied directly yet.
In contrast, the practice of an art in agribusiness focuses on using research findings to improve farming methods, agribusiness operations, or supply chain practices. Using the same example, a commercial farm manager might take that fertilizer-use theory and create a fertilization plan that optimizes cost and yield. By applying the theory to their specific farm conditions, they reduce input costs and increase profit. Similarly, agribusiness consultants might use market research theories to help farmers decide when and where to sell their produce for the highest return. This kind of research supports decision-making and directly impacts the success of agricultural enterprises.
Summary Table: Agribusiness Examples
| Aspect | Construction of Theory | Practice of an Art |
|---|---|---|
| Purpose | To understand agricultural relationships and trends | To apply research for better farm or business operations |
| Focus | Developing models or principles (e.g., crop yield vs. fertilizer use) | Using research to improve practices (e.g., creating cost-effective fertilization plans) |
| Example | Economists study diminishing returns in fertilizer use | A farm manager uses that research to apply just the right amount of fertilizer |
| Another Example | Researchers analyze global coffee price trends to build a pricing model | Exporters use the model to time their coffee sales and maximize profit |
3.5 Types of Research
There are many types of research, each suited to different goals, fields, and questions. Here’s a clear breakdown of the main types, grouped by purpose and method, followed by a table summarizing them.
1. Basic (or Pure) Research
This type of research is conducted to expand knowledge and understanding without immediate practical application. It aims to build theories and explore fundamental principles.
Example: Studying how plant cells respond to light at the molecular level.
2. Applied Research
Applied research is aimed at solving specific, practical problems by applying existing knowledge or theories.
Example: Developing a drought-resistant variety of rice based on genetic research.
3. Descriptive Research
This research describes characteristics of a population, situation, or phenomenon. It answers “what,” not “why.”
Example: Surveying farmers to understand their preferred methods of pest control.
4. Analytical Research
Analytical research goes deeper to analyze cause-effect relationships or interpret data using critical thinking and statistical tools.
Example: Analyzing data to determine whether organic farms have higher profit margins than conventional ones.
5. Quantitative Research
Quantitative research involves collecting numerical data and using statistical tools to draw conclusions. It focuses on measurement and objectivity.
Example: Measuring the effect of fertilizer levels on crop yield using statistical analysis.
6. Qualitative Research
This research is more exploratory and descriptive, focusing on experiences, perceptions, and behaviors, often using interviews or observations.
Example: Interviewing rural women farmers about challenges they face in accessing agricultural loans.
7. Experimental Research
Experimental research involves controlled testing to determine cause-and-effect relationships by manipulating variables.
Example: Testing different irrigation methods on identical crop plots to compare water efficiency.
8. Exploratory Research
Used when there is little existing knowledge about a topic. It helps define problems or develop hypotheses for future study.
Example: Exploring the potential of using drone technology in smallholder farming.
9. Correlational Research
This investigates the relationship between two or more variables, without necessarily proving causation.
Example: Studying whether there’s a link between farm size and adoption of precision agriculture.
10. Action Research
Action research is conducted by practitioners (like teachers, farmers, or managers) to improve their own practices through cycles of planning, acting, observing, and reflecting.
Example: A farmer testing and refining composting techniques over a growing season.
*Summary Table: Types of Research**
| Type of Research | Purpose | Example |
|---|---|---|
| Basic Research | Expand knowledge or theory | Studying photosynthesis at a molecular level |
| Applied Research | Solve practical problems | Developing pest-resistant crop varieties |
| Descriptive Research | Describe characteristics or trends | Surveying farmers’ irrigation practices |
| Analytical Research | Analyze and interpret data | Comparing productivity between organic and inorganic farms |
| Quantitative Research | Use numbers and statistics | Measuring yield increase from new fertilizer |
| Qualitative Research | Explore experiences and perspectives | Interviewing farmers about climate change impacts |
| Experimental Research | Test cause-effect with controlled variables | Testing fertilizers on two identical crop plots |
| Exploratory Research | Investigate new or unclear topics | Exploring AI use in small-scale farming |
| Correlational Research | Study relationships between variables | Linking education level to adoption of technology |
| Action Research | Improve own practice through iterative inquiry | Farmer testing new seed spacing methods and adjusting based on results |
3.6 Research Design
A research design is the overall strategy or blueprint for conducting research. It outlines how to collect, measure, and analyze data to answer research questions effectively. A good research design includes these key components:
- Problem Statement / Research Problem
- Objectives of the Study
- Hypothesis (if applicable)
- Type of Research / Research Methodology
- Data Collection Methods
- Sampling Design
- Tools for Data Analysis
- Time Frame / Timeline
- Limitations
Sample Research Design Case Study (Agribusiness Example)
Title:
“Impact of Digital Marketing on Sales Revenue of Small Agribusiness Enterprises in Kenya”
1. Problem Statement
Small agribusinesses in Kenya face challenges in accessing wider markets and increasing their sales. While digital marketing is becoming more accessible through platforms like Facebook and WhatsApp Business, it is unclear how effective these tools are in boosting revenue for small agribusinesses.
2. Objectives of the Study
- To evaluate the adoption level of digital marketing among small agribusinesses.
- To assess the relationship between digital marketing usage and sales revenue.
- To identify the challenges faced in implementing digital marketing strategies.
3. Hypothesis (Optional)
H₀: There is no significant relationship between the use of digital marketing and sales revenue in small agribusinesses.
H₁: There is a significant positive relationship between the use of digital marketing and sales revenue in small agribusinesses.
4. Type of Research / Methodology
This is applied, analytical, and quantitative research. It uses a correlational design to study the relationship between digital marketing usage and revenue performance.
5. Data Collection Methods
- Structured questionnaires distributed to small agribusiness owners.
- Secondary data from financial reports or sales records (with consent).
- Interviews (optional) to complement quantitative data.
6. Sampling Design
Population: Registered small agribusiness enterprises in Nairobi and Kiambu counties.
Sample Size: 100 businesses selected using stratified random sampling (by type: dairy, horticulture, poultry, etc.).
Sampling Frame: List of businesses from the county agribusiness registry.
7. Tools for Data Analysis
- Descriptive statistics (mean, percentages) for summarizing data.
- Correlation analysis and regression (using SPSS or Excel) to test the relationship between marketing and revenue.
- Charts and tables to visualize findings.
8. Time Frame / Timeline
- Proposal and design: 1 month
- Data collection: 2 months
- Data analysis and report writing: 1 month
- Total duration: 4 months
9. Limitations
- Self-reported data may be biased or inaccurate.
- Not all businesses may keep accurate sales records.
- Findings may not be generalizable to larger agribusiness firms or other regions.
Explaining the Components Based on the Case Study
| Component | Explanation Based on the Case |
|---|---|
| Problem Statement | Identifies the gap: unclear effectiveness of digital marketing on sales in small agribusinesses. |
| Objectives | Clarifies what the study aims to find out — adoption level, impact, and challenges. |
| Hypothesis | Suggests a testable claim about the relationship between marketing and revenue. |
| Type of Research | Applied (real-world problem), quantitative (numerical data), and analytical. |
| Data Collection Methods | Uses surveys and sales records — suitable for both statistical and business analysis. |
| Sampling Design | Specifies how the participants will be chosen — ensuring diversity and representation. |
| Tools for Analysis | Matches the data type — correlation and regression to test relationships between variables. |
| Time Frame | Provides a realistic schedule for completing the study. |
| Limitations | Acknowledges challenges in data quality and generalizability. |
3.7 Data Analysis and Interpretation
Background
A mid-sized agribusiness company (“AgroGrow Ltd.”) cultivates maize and soybean across three regions (North, Central, South). Management wants to understand:
- Crop yield performance across regions.
- Relationship between rainfall, fertilizer usage, and yield.
- Profitability trends by crop type.
The company provided 2020–2023 data on crop yields, rainfall, fertilizer usage, and profits.
Dataset (Simplified Example)
| Year | Region | Crop | Yield (tons/ha) | Rainfall (mm) | Fertilizer (kg/ha) | Profit ($/ha) |
|---|---|---|---|---|---|---|
| 2020 | North | Maize | 3.2 | 820 | 55 | 410 |
| 2020 | Central | Maize | 3.8 | 900 | 60 | 450 |
| 2020 | South | Soybean | 2.5 | 760 | 40 | 300 |
| 2021 | North | Maize | 3.6 | 870 | 58 | 430 |
| 2021 | Central | Soybean | 2.9 | 910 | 45 | 340 |
| 2022 | South | Maize | 4.1 | 940 | 62 | 480 |
| 2023 | North | Soybean | 3.0 | 890 | 47 | 360 |
Analysis & Visuals
- Crop Yield by Region
We examine average yields to identify high-performing regions.
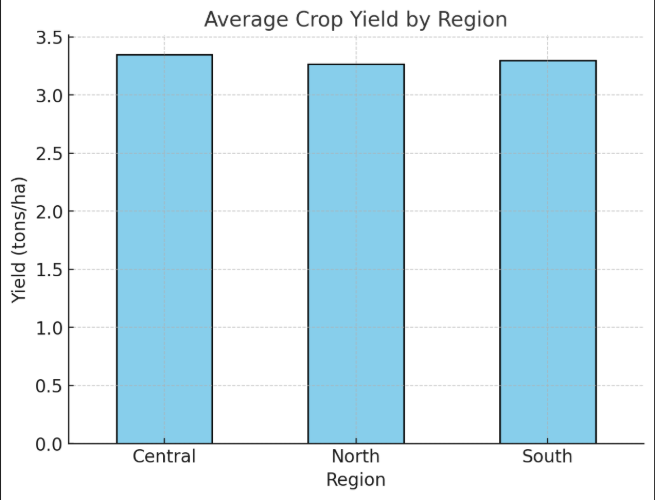
Interpretation
- South region shows the highest average yield (thanks to favorable rainfall and fertilizer use).
- North region performs steadily but slightly lower.
- Central region varies depending on crop type.
- Rainfall vs Yield

Yields generally rise with rainfall up to ~900 mm.
Beyond that, the yield plateaus — suggesting diminishing returns from excess rainfall.
- Fertilizer vs Yield
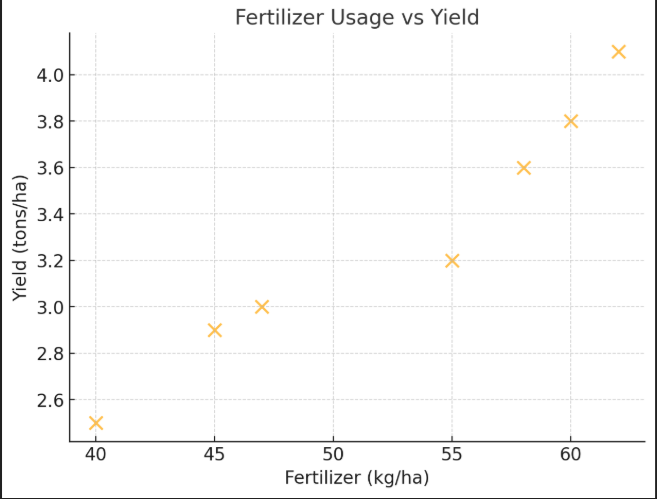
Moderate fertilizer usage (55–62 kg/ha) strongly correlates with higher yields.
Under-fertilized plots (40–45 kg/ha) show lower productivity.
- Profitability Trend (2020–2023)
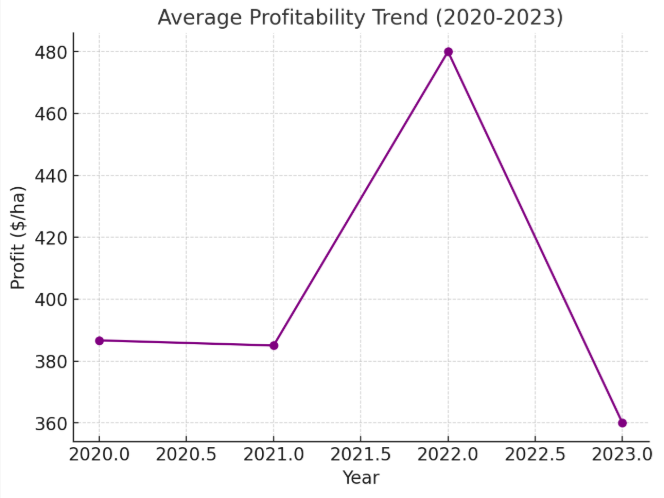
Average profits steadily increased year over year.
This reflects yield improvements and better input management, especially in the South region.
3.8 Creating Portfolio
As a student of data science, you are always asked about portfolio in the job interview. A portfolio is a collection of data science projects which can be showed to a prospective employers so that they can assess your experience, skills and though process on data science projects.
Primarily, you can get three types of work in data science -
- A Job that involves data science skills, roles and responsibilities
- A Freelance opportunity for data science projects
- You are building your own data science led startup/Micro SaaS/training business
In the first two types, you need to showcase your portfolio of projects so that prospective employer or freelance project owner can find if you are a fit for the role or not.
There any many platforms to host portfolio websites - Github, Hostinger, Hugo, DataLab, WordPress, Kaggle, Medium, DataCamp Workspace, shinyapps.io, Posit Connect, Amazon Web Services, Microsoft Azure,Netlify, https://www.datascienceportfol.io/, upwork, freelancer.com,Social Media sites like LinkedIn. Visit the sample portfolios shared in the links below:
Sample Portfolios for inspiration